
Benchmarks
We will continuously update this page as new benchmarks are published.
Artificial Analysis Benchmarks Cogniware vs. vLLM
Published 6/24/26
Artificial Analysis has become one of the AI market’s most watched independent benchmarking sources. Their work is followed by engineers, founders, infrastructure teams, investors, and major AI companies. Their AI performance benchmarking has been referenced by industry leaders ranging from Nvidia to Elon Musk.
Artificial Analysis has now completed its first benchmark of Cogniware versus the industry-leading vLLM inference engine.
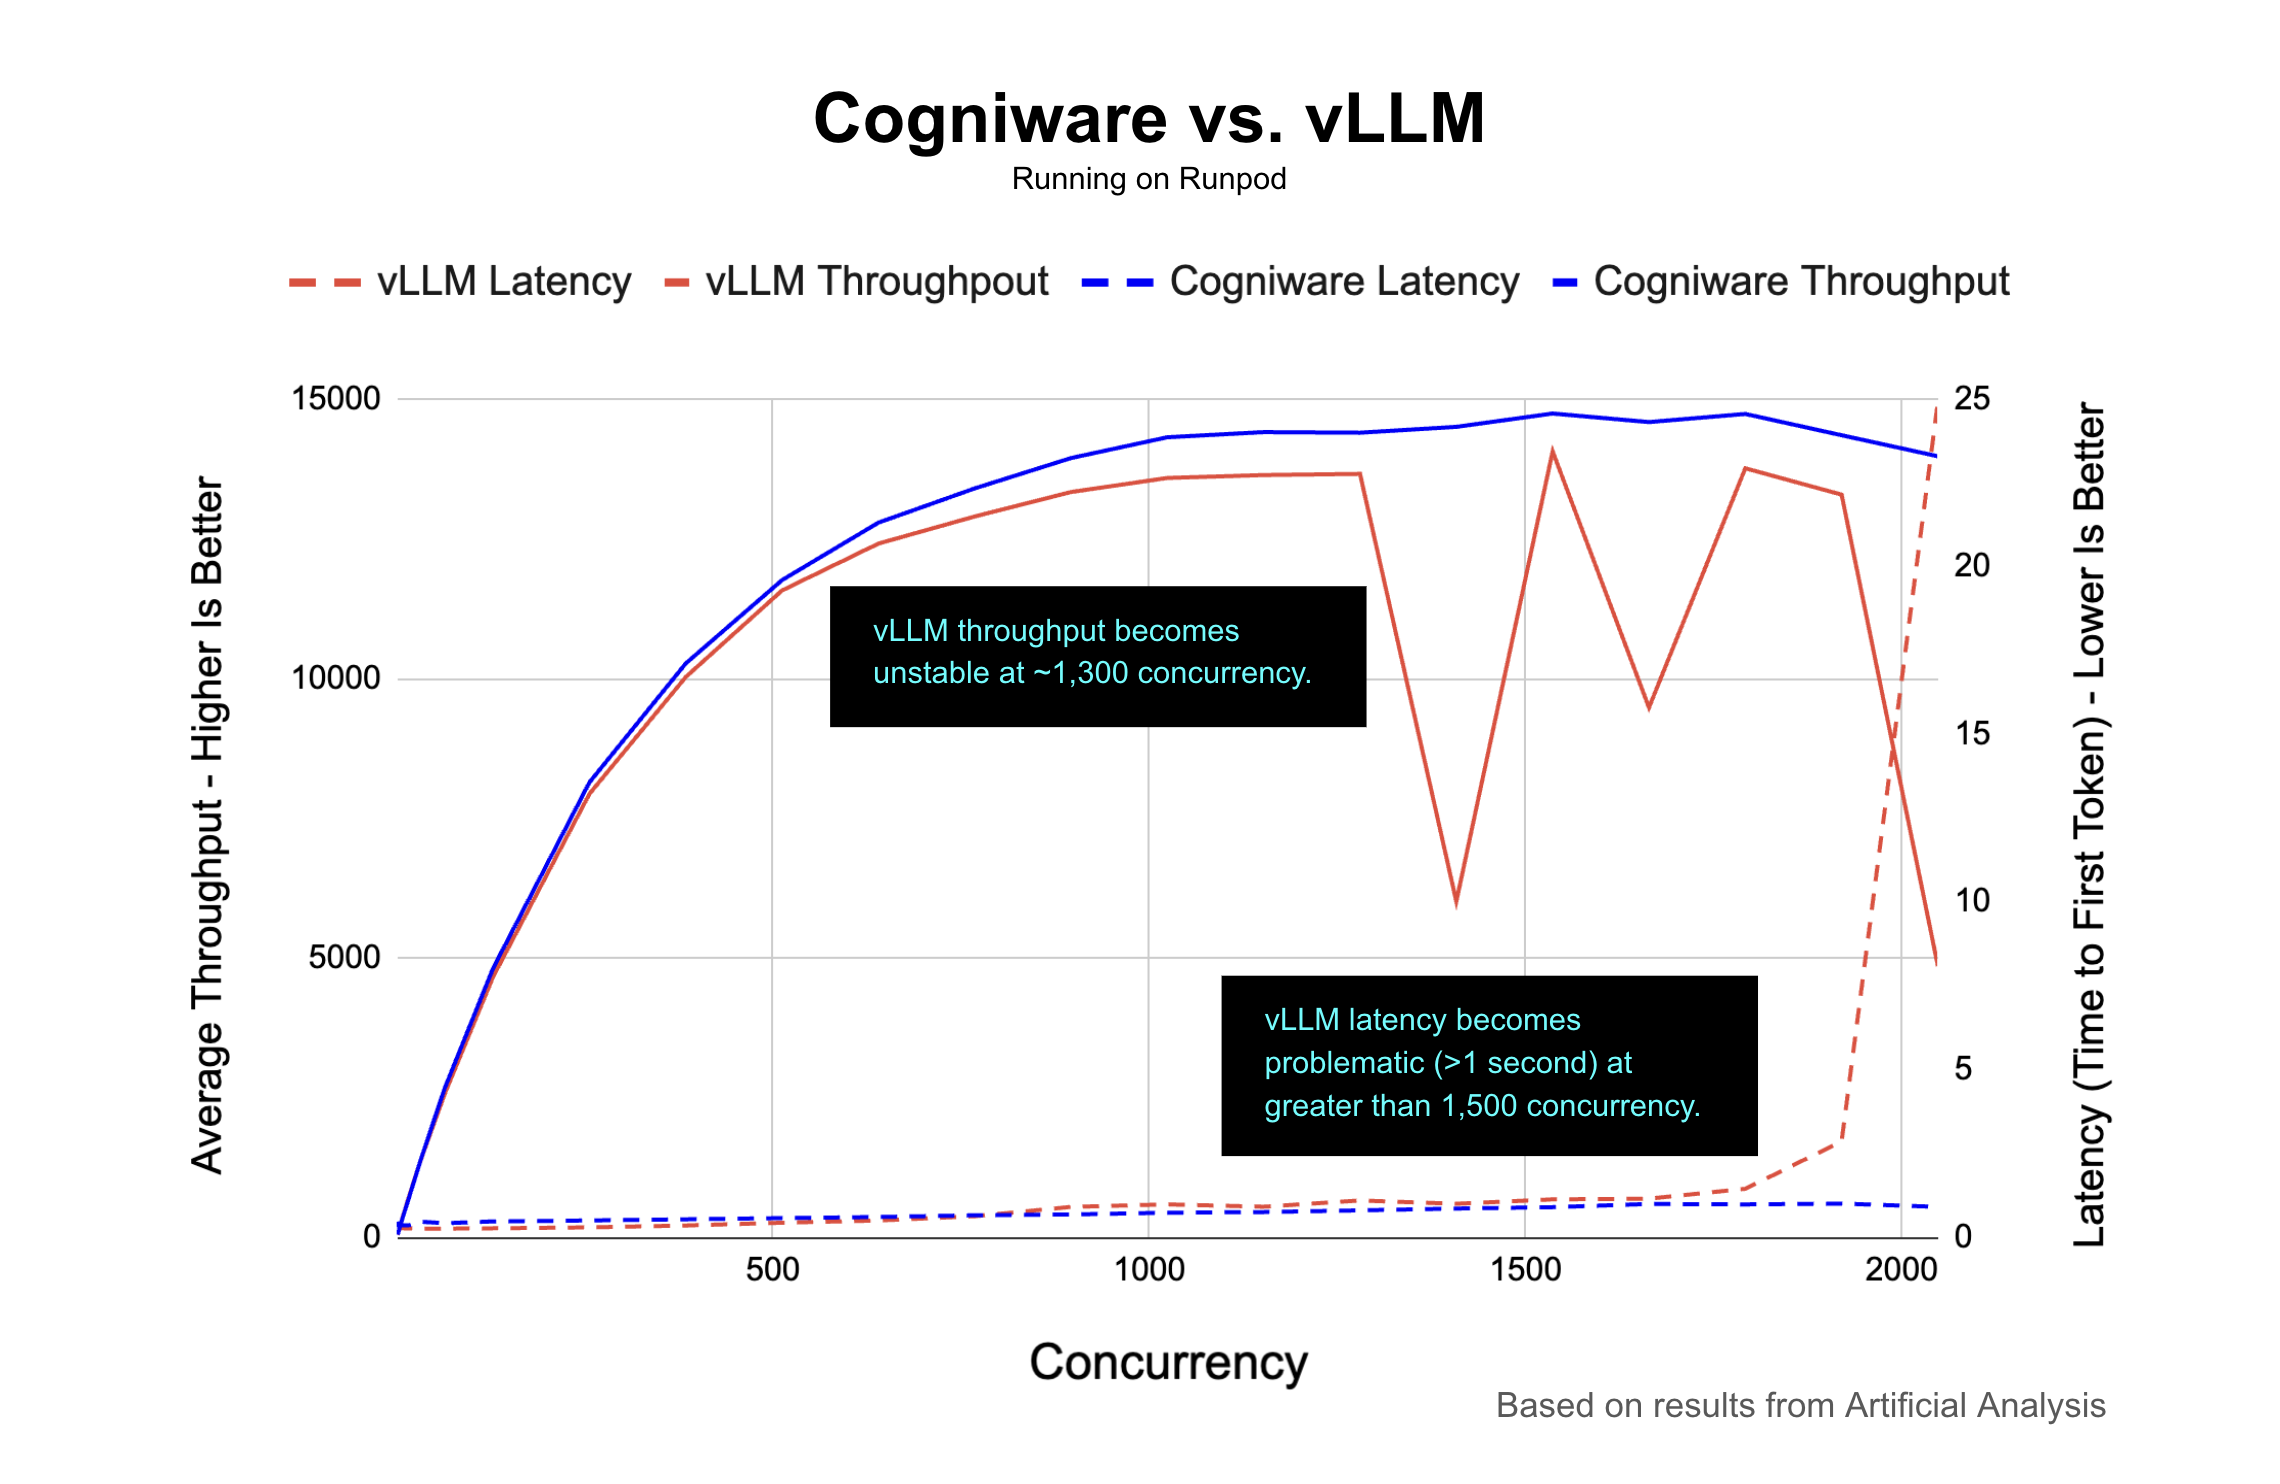
Their independent benchmark compared Cogniware Inference against three non-Cogniware vLLM baselines: one on Oracle Cloud Infrastructure (OCI) and two on RunPod. The workload was the same across systems:
Llama 3.3 70B Instruct.
bf16 precision.
vLLM 0.19.1.
8× NVIDIA H200-SXM GPUs.
1,000 input tokens and 1,000 output tokens per request.
Concurrency tested from 1 to 2,048.
The benchmark found that Cogniware was faster and generated more token throughput. But even more significantly, Cogniware kept performing when concurrency rose.
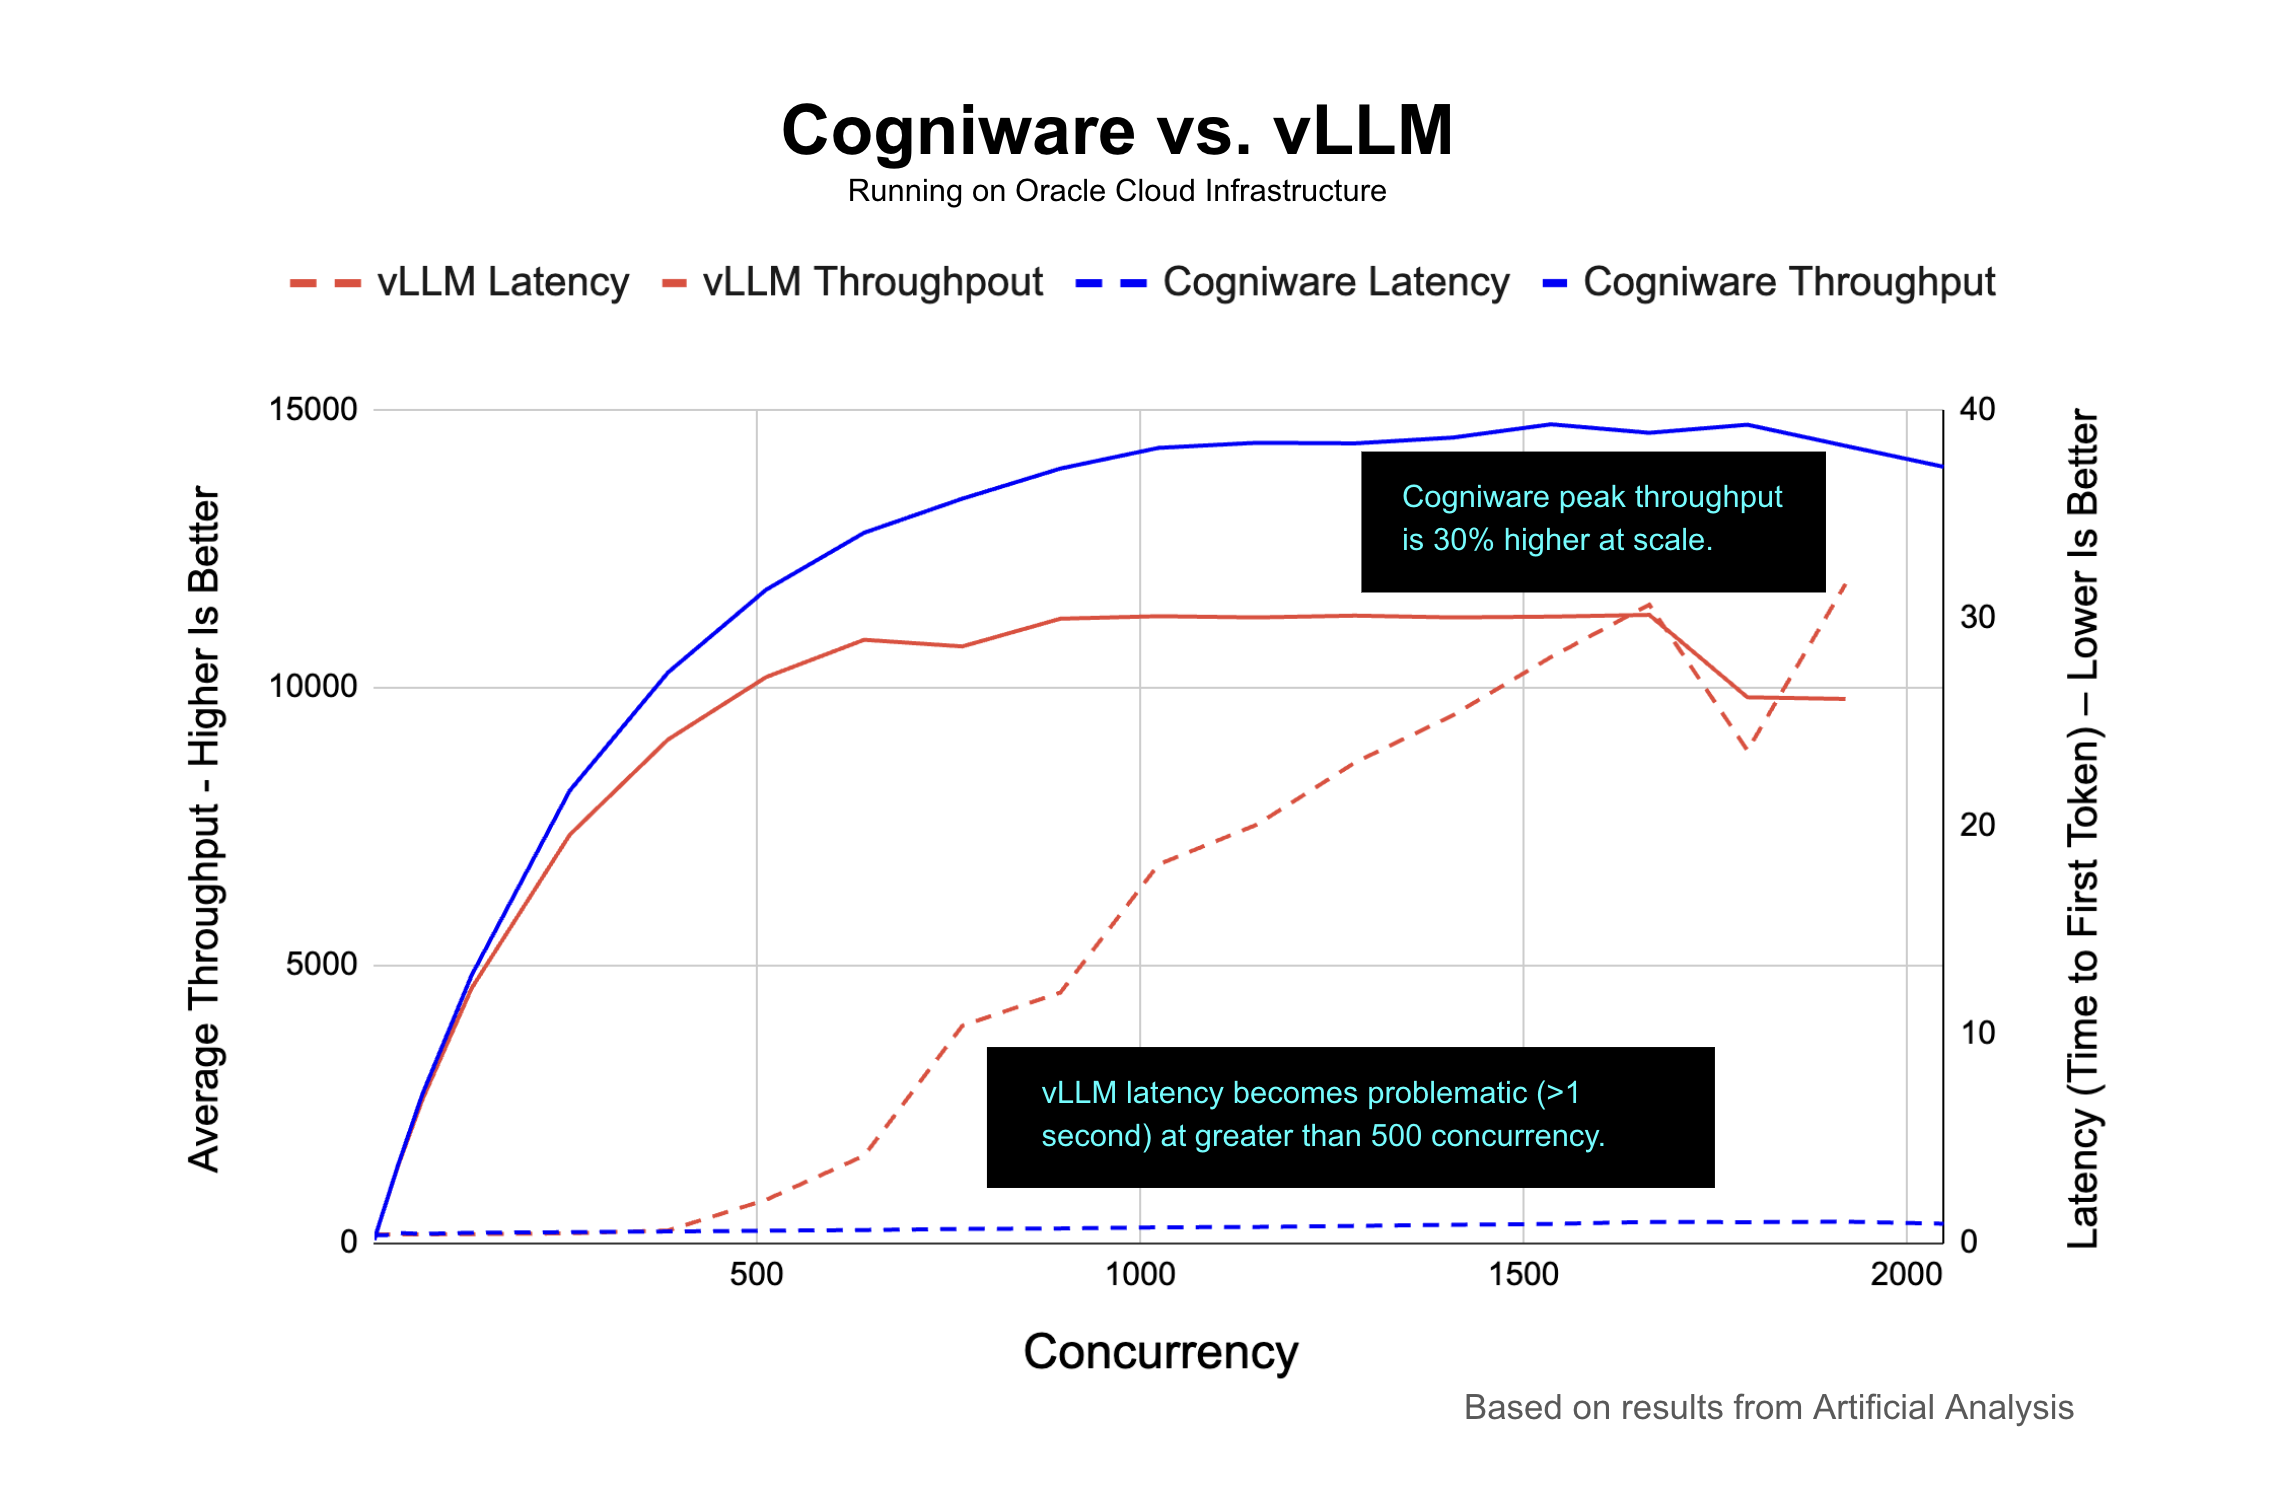
Cogniware peaked at about 14.7K output tokens per second and still held roughly 14K tokens per second at 2,048 concurrency. Compared with the OCI vLLM baseline, that is about 24% higher sustained throughput than the baseline’s roughly 11.3K tokens-per-second plateau, and about 30% higher peak throughput as reported by Artificial Analysis.
But raw throughput is only part of the story.
At scale, throughput without acceptable latency is not useful. If the system generates more tokens but users wait 20 or 30 seconds before seeing the first one, that is not a production experience most teams can live with.
Cogniware kept median time to first token at roughly one second or less across the full concurrency range.
The vLLM baseline on OCI looked comparable at lower concurrency, then broke down as load increased. Around 512 concurrency, the latency gap started to open. At 1,024 concurrency, Cogniware’s median TTFT was 0.73 seconds. The baseline was 18.17 seconds. At 1,920 concurrency, Cogniware was 1.01 seconds. The vLLM baseline on OCI was 31.64 seconds.
That is the difference between a system that still feels responsive and one that no longer does.
The RunPod vLLM aggressive baseline performed better than the OCI system for longer. At peak, it came close to Cogniware on raw throughput. But under heavier load, the behavior became unpredictable. Its throughput fell from about 13.6K tokens per second at 1,024 concurrency to about 4.9K at 2,048. Its median TTFT also climbed to 24.93 seconds at 2,048 concurrency.
The conservative RunPod baseline showed the same basic failure mode at high concurrency, reaching 39.08 seconds median TTFT at 2,048.
Response rate told a similar story. Cogniware stayed at or above 92% response rate from 1 to 2,048 concurrency. The baselines started to fail at higher load: RunPod aggressive dropped to 54% at 1,408 concurrency, vLLM on OCI dropped to 75% at 1,920, and RunPod conservative dropped to 77% at 2,048.
The takeaway is straightforward.
Under this workload, Cogniware delivered more usable inference capacity from the same eight-GPU class of system. More token throughput. More concurrent requests. Lower median TTFT. Higher stability when the system was pushed.
This was one benchmark, on one model, with one 1,000-token-in / 1,000-token-out workload. But it is still an important result that demonstrates the promise of the Cogniware architecture – superior performance and efficiency on any system configuration and LLM.
If you are trying to run inference at scale, the question is not just whether the model responds. It is whether the system keeps responding when concurrency rises and the economics start to matter.
Cogniware v1 accomplished that in this benchmark.